Originally published . AI polished for a better reading experience: .

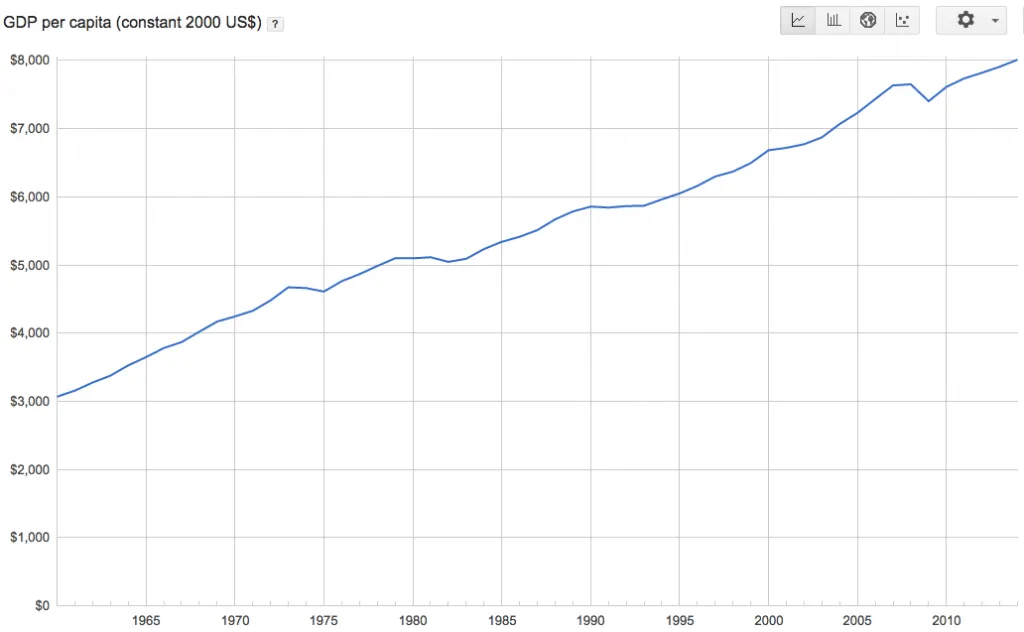
The chart above, from Google Public Data, shows world GDP per capita from 1960 to 2014 in constant US dollars of 2000. Inflation is stripped out: one dollar of 1960 has the same purchasing power as one dollar of 2014 in this series. Put another way—if one dollar bought one Big Mac—an average world citizen could buy about 3,000 Big Macs a year in 1960 and about 8,000 in 2014.
That rise is unprecedented. In practical terms it says the world population of the mid-2010s lived roughly 2.67 times better, in income terms, than people in 1960. The path required a compound annual growth rate of about 1.83%. What drove it? Economics Online lists four classic causes: new technology, specialisation of labour, new production methods, and discovery of new raw materials. I would reduce those drivers to two: growth in scientific research and growth in energy output. Over the long run I would leave only one: the expansion of scientific research.
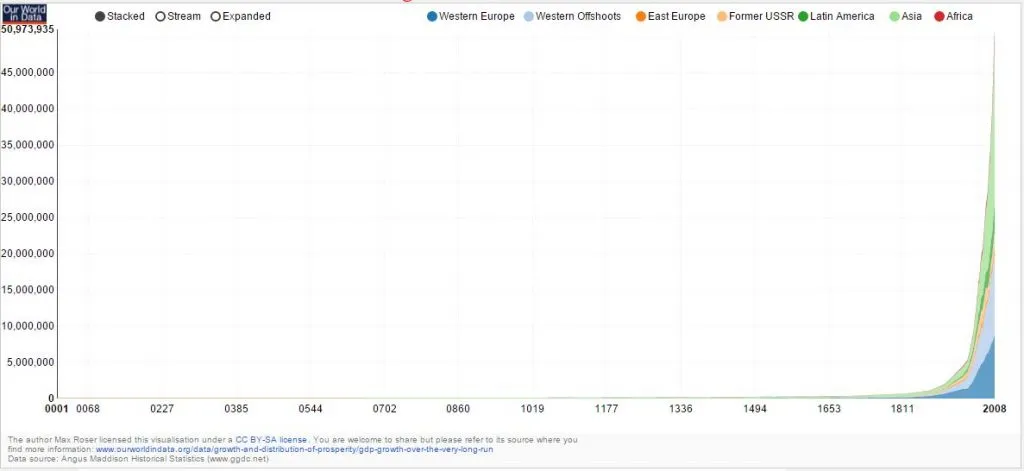
A longer horizon confirms the same story. Serious, sustained growth in GDP per capita took off when the scientific method spread through Europe. For most of human history income per person was low and nearly flat. Real acceleration begins only when science gains weight in Western society.
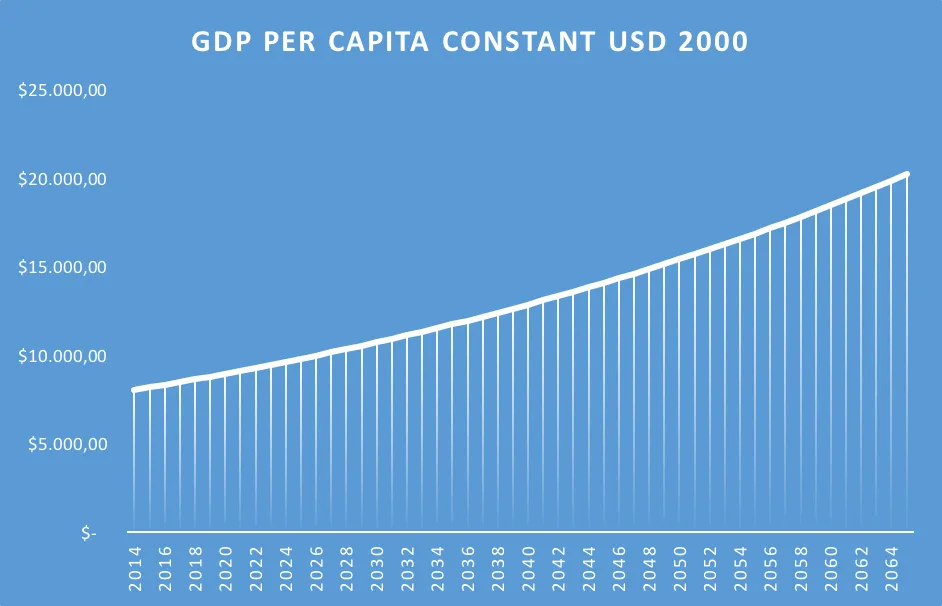
For a little fun, an Excel-style projection of the same trend suggests that by 2065 average world GDP per capita could sit around 20,000 USD—levels comparable to many EU countries in the 2010s (Spain’s GDP per capita in 2014 was about 25,000). Imagine a world where the average person lived roughly as people in Spain do today.
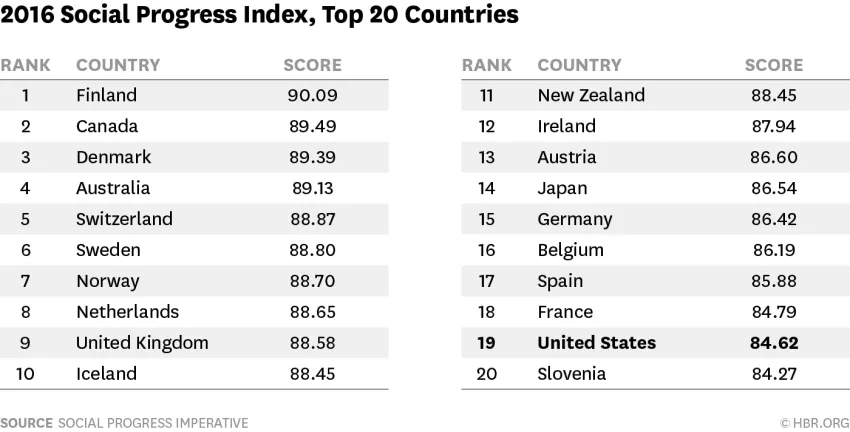
There are caveats. In most places, rising GDP per capita tracks better social standards—but not always. In the United States the link is weaker. An HBR piece, “Why Americans Are So Angry Despite America’s Strong Economy”, compares the Social Progress Index in the US with peer countries of similar income. Steady economic growth there has not translated one-for-one into rising well-being. Some mechanisms of wealth distribution are failing.
The task for current generations is to make sure that gap is not the default in 2065. Now is the moment to design mechanisms that turn growth into real improvement in people’s lives. We need as many people as possible engaged in the economy of science so they can contribute to global growth. The best way to do that is to empower them through access to wealth—so they receive the tools to multiply that wealth.
I expand on this vision of economic growth in How I understand economic growth.
Comments
Loading…
Log in or register to comment.