Originally published . AI polished for a better reading experience: .
What is economic growth? From time to time I wondered what kind of empirical evidence could explain the changes the world has experienced over the last two centuries. Economy classes at IESE shed some light on that question for me.
It seems obvious that we live better than people did in the nineteenth century, but I struggled to understand how to quantify that difference. There is an extra problem: economists usually work with relative parameters that change all the time. There are very few constants in the economy, and in most cases those “constants” are estimated rather than fully measurable. Think of money as a way to explain growth. The value of money depends on exchange rates, monetary policy, interest rates, inflation, and many other factors. Representing things in money alone is therefore a tricky business. Economists try to impose order on that variability by stripping out many of those factors — especially inflation — and presenting values in “constant money.” Sometimes purchasing power parity (PPP) is also used for comparisons. My preferred measure, though, is time: the time an average worker must work to buy a specific product that is similar in every case you compare. The best-known example of this kind is the Big Mac index. If you know the price of a Big Mac almost everywhere and you have data on average wages, you can calculate how long an average worker needs to earn enough for that meal. With a similar method you can compare wellbeing in the past and today, using historical product prices and salaries as the reference.
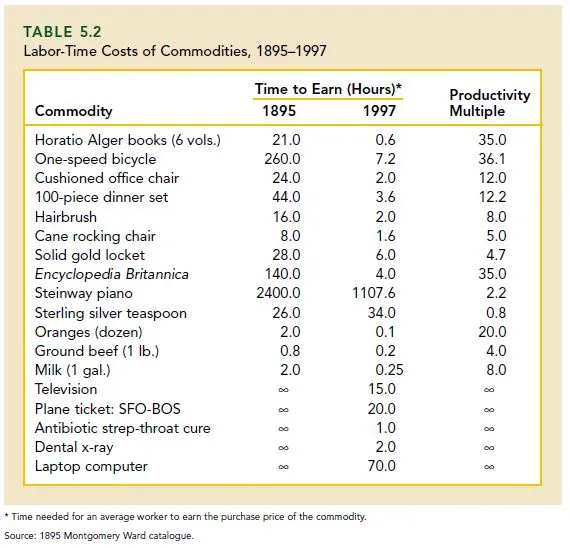
These methods capture the long-term trend with reasonable accuracy, yet sometimes you still need to grasp the exact meaning of acronyms such as real GDP per capita or PPP before the full picture snaps into place. Once you do (at least in my case), the picture is beautiful — especially because the future looks bright for humanity.
Why? Let us visualise it. There are basically three economic models that explain growth. The first, the Malthusian model — quite pessimistic and dating from the nineteenth century — predicts that improvements in wellbeing lead to population growth, which then lowers GDP per capita by increasing the number of “capitas.”
The second, the neoclassical model associated with Robert Solow, holds that capital accumulation can boost growth up to a point, after which growth stabilises and remains constant.
Finally, endogenous growth theory says that, thanks to entrepreneurship and human ingenuity, growth can be steady and unlimited — provided investigation, science, and technology receive the right stimulus. I spoke of a bright future because, if the past helps us explain the future, the graph below hints at which model is closer to reality:
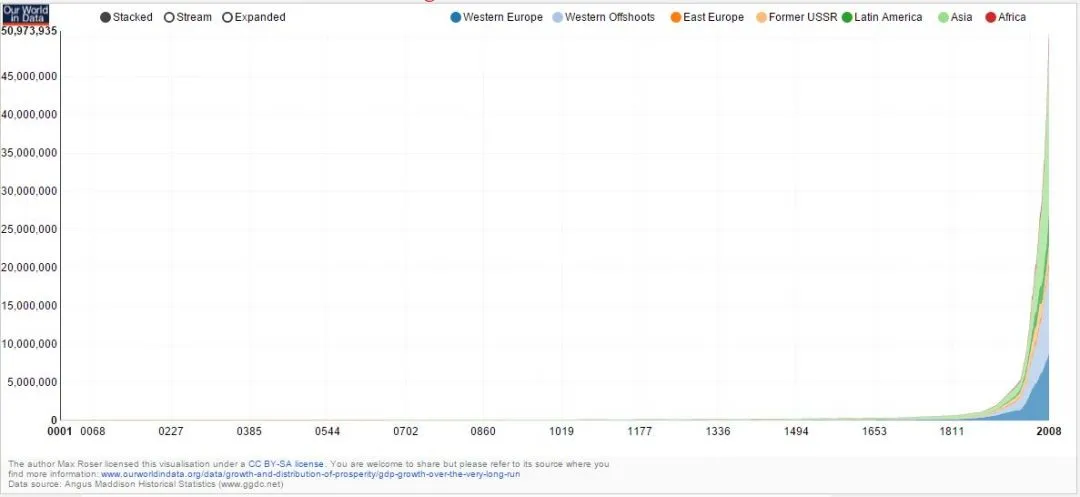
The graph largely speaks for itself. From year 1 until around 1820, growth looked Malthusian — almost non-existent. Once humanity began to incentivise science and progress, growth per capita boomed. Population also experienced an unprecedented rise, as the next chart shows.
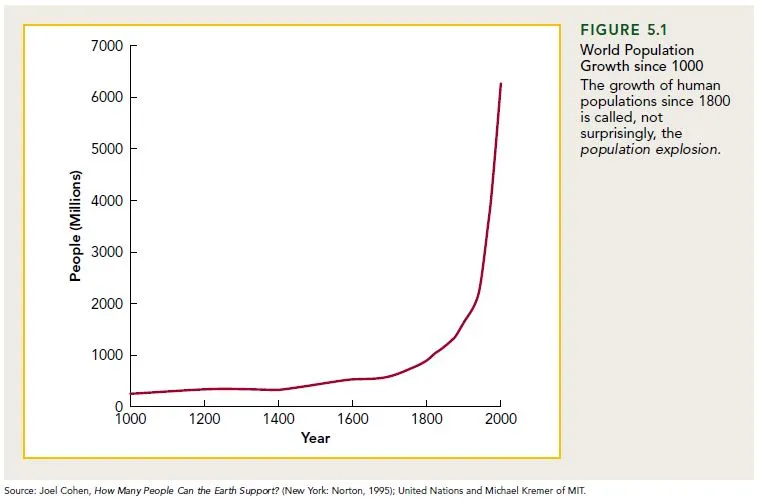
Human ingenuity mattered far more than population growth, so in general terms our lives improved drastically. The best part of the story is that nothing known today can stop this trend. If anything, the growth rate may accelerate.
Singularity
Taken from the scientific term for the threshold of events near a massive black hole — I mean astronomy, not whatever else came to mind — singularity here is the moment when a computer becomes powerful enough not only to outperform humans, but to create a machine more sophisticated than itself. That would lead to exponential, hard-to-predict growth. In that case GDP per capita would be virtually limitless. Let us hope we live to see it.
Comments
Loading…
Log in or register to comment.